


AI & Enterprise Technology Content Specialist
Incident response automation helps engineering and SRE teams detect, investigate, and resolve production incidents faster by automating repetitive tasks and workflows. This blog explores the key benefits of incident response automation, popular tools, and best practices for implementing automation effectively. Learn how to reduce manual effort, improve mean time to resolution (MTTR), minimize alert fatigue, and build a more reliable incident management process while maintaining human oversight for critical production decisions.
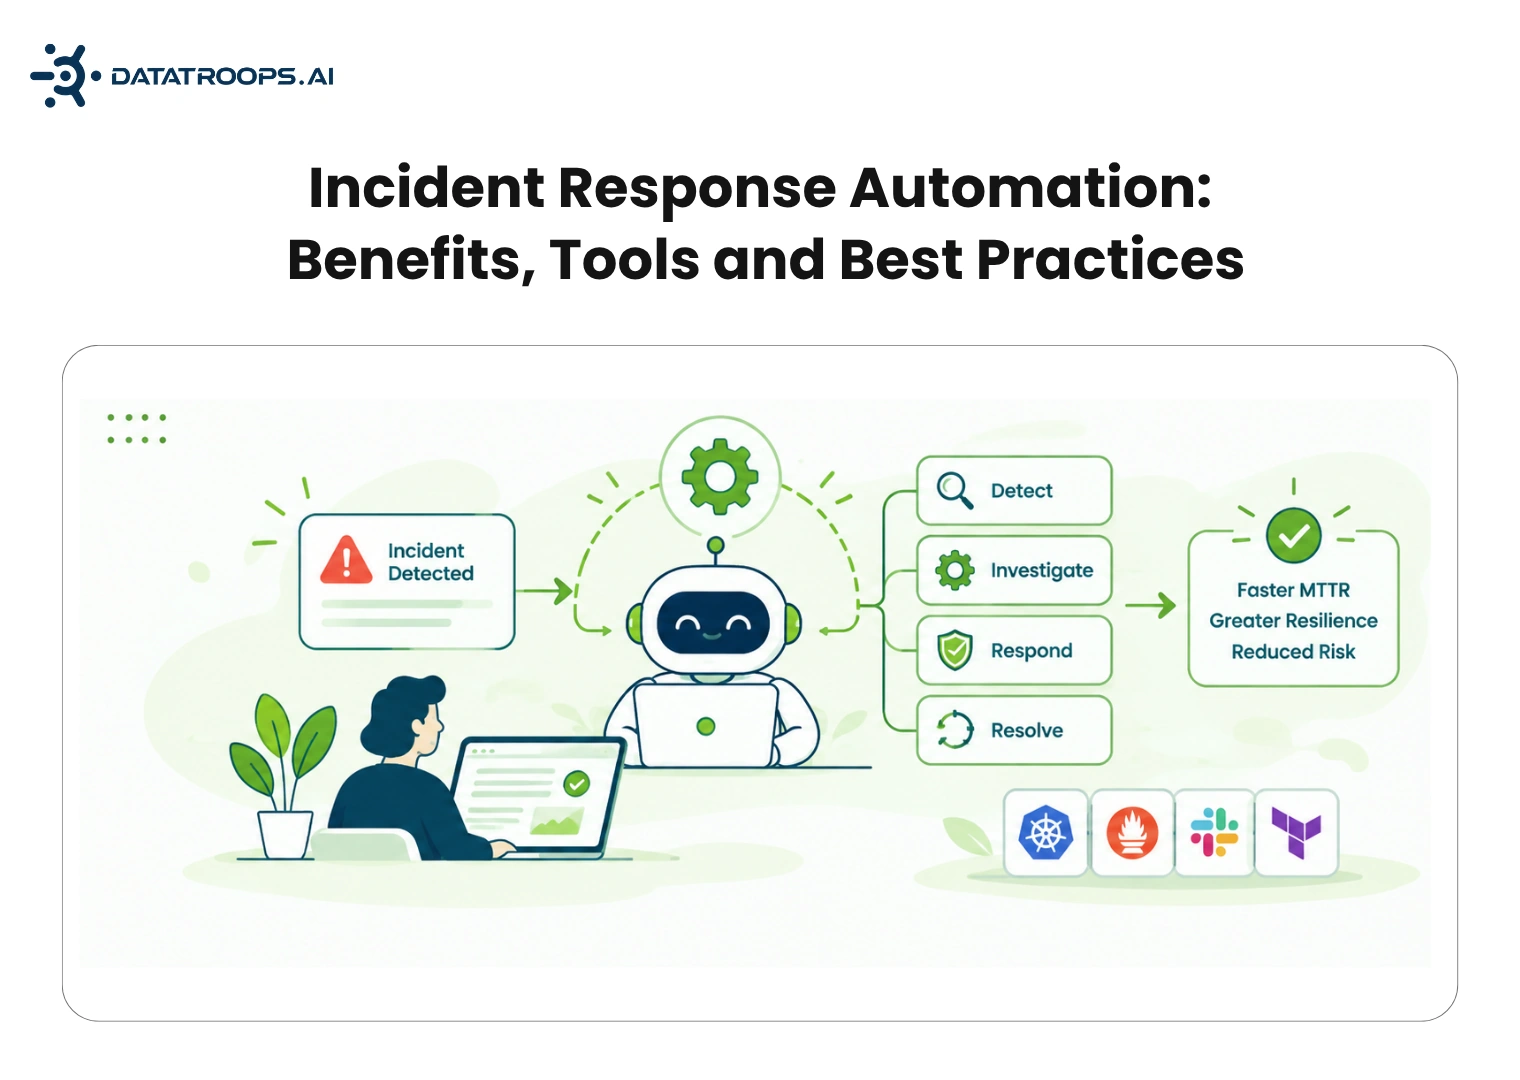
The alert fires at 2:47 a.m. By 2:55, the on-call engineer still has not opened a single dashboard. They are waking up, finding their laptop, and trying to remember which service owns the endpoint that just started throwing 500s. That eight minutes is not unusual. It is the norm.
This post is for teams running production services, especially JVM, Scala, Kafka, and data-pipeline stacks, who are past asking 'should we automate incident response?' and into the harder question: what do we automate first, and what do we deliberately keep human? We will cover what incident response automation actually is, where it pays off, the tools worth knowing in 2026, and the practices that separate automation that helps from automation that just adds noise.
Here is the uncomfortable truth about most incidents: very little of their duration is spent actually fixing anything. Most of it goes to finding the right dashboard, pulling the right logs, checking what deployed recently, and figuring out who owns the thing that broke.
As systems grow into dozens of services, queues, and pipelines, that overhead stops being a minor annoyance and becomes the dominant cost of every outage. Alerts multiply, on-call engineers burn out, and because nobody has time to close the loop after the fire is out, the same incidents keep recurring. The entire value of automation is eliminating that dead time so humans spend their attention on judgment calls, not busywork.
Incident response automation uses software to run the repeatable steps of handling a production incident, so humans spend their time on judgment rather than routine. It spans the full lifecycle, not just alerting.
The incident lifecycle Detect → Triage → Mobilise → Diagnose → Remediate → Communicate → Learn. The final stage feeds back into Detect, so every incident makes the next one easier to catch.
Each stage has work that can be automated: correlating alerts at detection, routing and paging at mobilisation, gathering evidence at diagnosis, running known fixes at remediation, and drafting status updates and postmortems at the end.
Automation and AI are not the same thing, and the distinction matters.
The practical implication: automation executes, AI investigates. The best 2026 incident response stacks use rule-based automation for anything deterministic and reversible, and AI agents for the diagnostic legwork that used to eat an engineer's first twenty minutes.
Take a typical 'API returning elevated 500s' incident and break down where the minutes go:
| Step | Time | Automatable today? |
|---|---|---|
| Alert fires, correlated with related alerts | ~1 min | Yes, deduplication and correlation |
| Paging the right person, escalation if unacknowledged | ~3 min | Yes, routing and escalation |
| Engineer opens dashboards, pulls logs and metrics | ~10 min | Mostly, enrichment can pre-attach this |
| Checking recent deploys and config changes | ~6 min | Yes, diff and deploy history checks |
| Forming a hypothesis about root cause | ~10 min | Partially, AI agents can rank likely causes |
| Confirming root cause and deciding on a fix | ~5 min | No, needs human judgment |
| Executing the fix (restart, rollback, scale) | ~3 min | Yes, for safe and reversible actions |
| Verifying recovery | ~2 min | Yes, metrics against baseline |
| Writing the incident summary | ~10 min | Mostly, timeline capture and draft postmortem |
Add it up, and roughly 35 of the 50 minutes in this incident is repeatable work: evidence-gathering, routing, and documentation, not the actual decision that fixes anything. That is the gap automation closes.
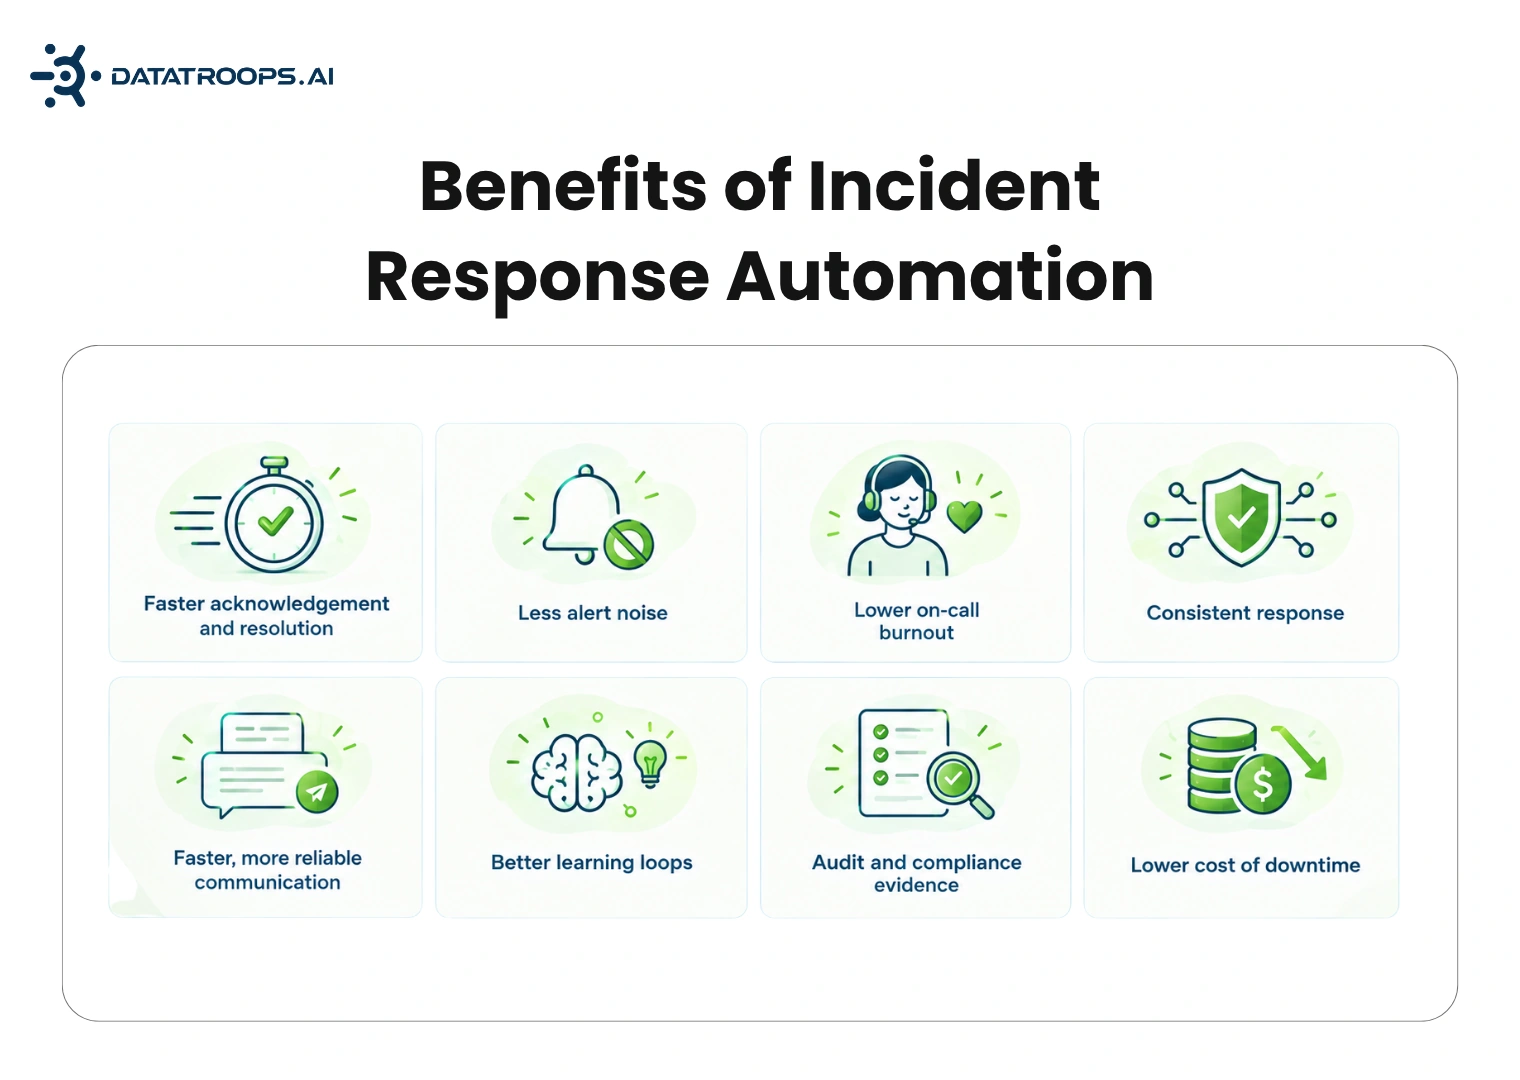
The biggest win is time: automation removes the waiting and the evidence-gathering, which are usually most of an incident's duration.
Start with the steps that are frequent, low-risk, and reversible. Keep humans on anything that changes production or makes a customer-facing commitment.
| Stage | Automate first | Keep a human in the loop |
|---|---|---|
| Detect | Alert deduplication, correlation, severity tagging | Tuning thresholds and SLOs |
| Triage | Enriching alerts with owner, recent deploys, dashboards | Declaring a major incident |
| Mobilise | Paging, escalation, creating the incident channel and bridge | Choosing the incident commander for SEV1 |
| Diagnose | Pulling logs, metrics, traces, and diffs; ranking likely causes | Confirming the root cause |
| Remediate | Safe, reversible actions: restart a pod, scale out, clear a queue, roll back a flagged deploy | Data fixes, schema changes, failovers, anything irreversible |
| Communicate | Status page drafts, stakeholder updates, timeline capture | Customer-facing wording for major outages |
| Learn | Postmortem draft, action-item tickets, recurrence tagging | Agreeing the actions and owners |
The pattern across every row: automate the gathering, keep humans on the deciding.
Here is where a lot of otherwise-good automation quietly falls apart. Most AI SRE agents on the market in 2026 were trained and tuned overwhelmingly on Kubernetes and web-tier failure patterns: HTTP error codes, container restarts, autoscaling events. That is most of the observability data on the internet, so it is what the agents are best at.
It is also not where JVM-heavy, Kafka-driven, data-pipeline production stacks tend to actually fail.
None of this is a knock on the tools. It is a mismatch between what they were built to see and what your stack actually produces. Stack-specific failure modes need stack-specific context, whether that context lives in a fine-tuned agent, a well-written runbook, or an engineer who has debugged this exact pipeline before.
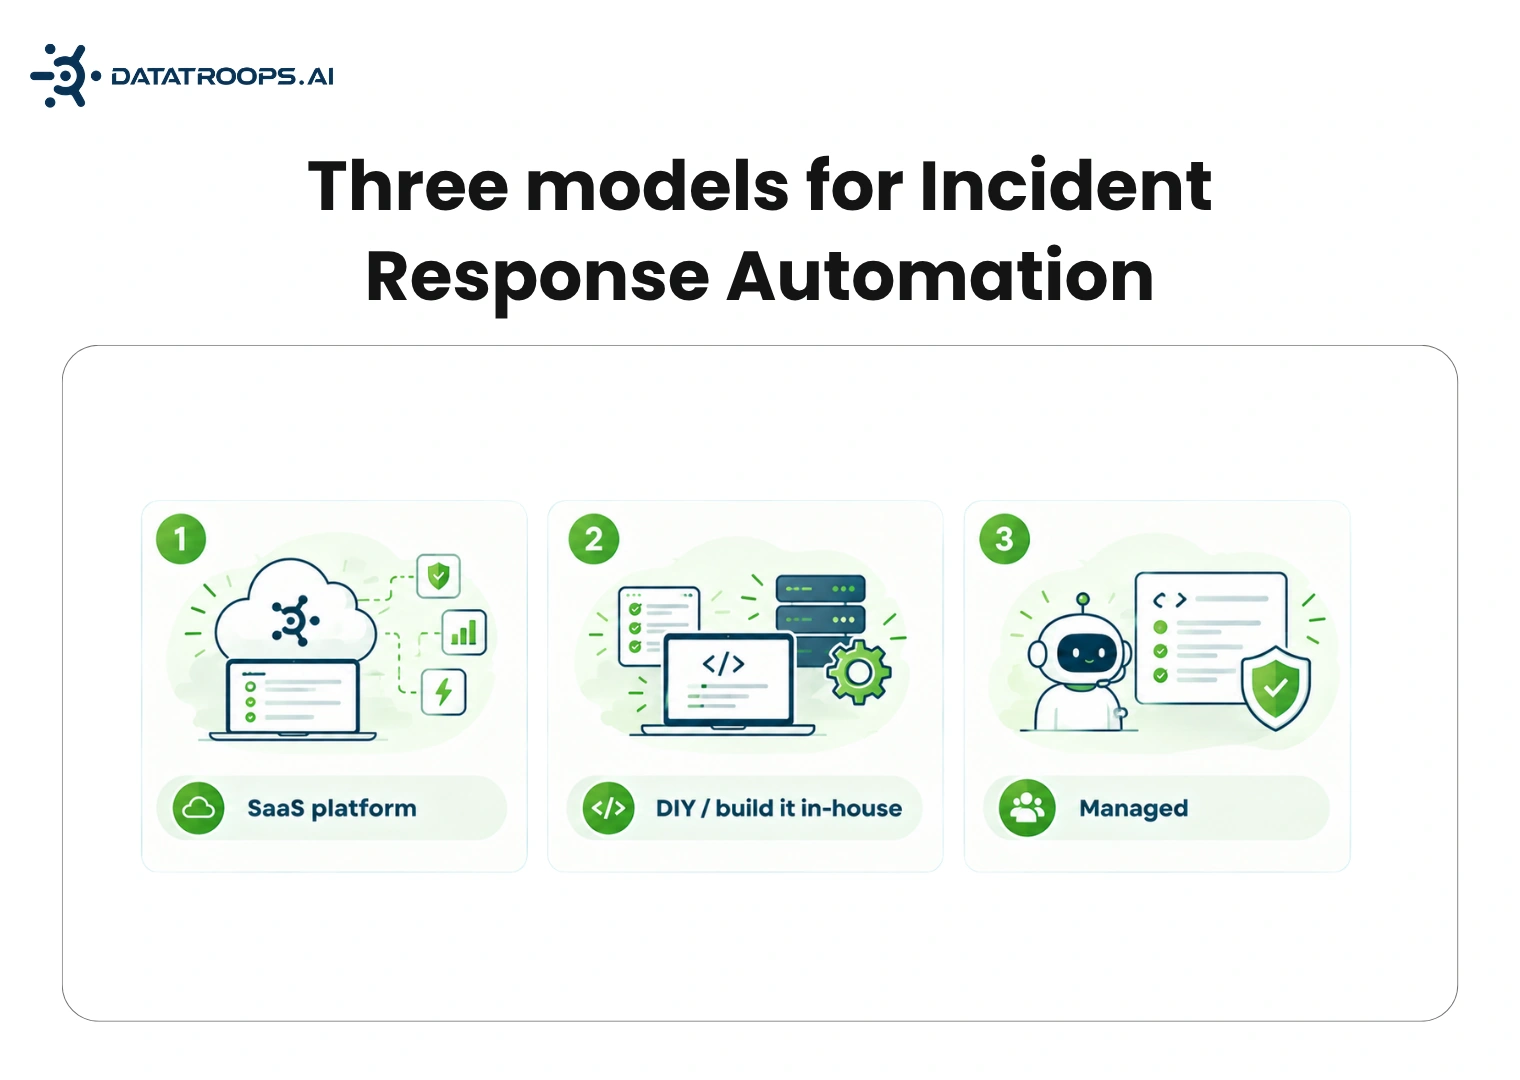
Once a team decides to invest in automation, there are really three paths, and most teams underestimate how different the ongoing cost looks between them.
None of these is universally right. A small team with a simple web-tier stack may do perfectly well on a SaaS tool. The calculation changes once GC pauses, consumer lag, and Spark skew are a regular part of your incident history.
For regulated or sensitive workloads, where the automation runs matters as much as what it does. Keeping telemetry inside your own environment, rather than shipping logs and traces to a third party's cloud, is increasingly non-negotiable for fintech, payments, and healthcare teams working under frameworks like SOC 2, PCI DSS, or HIPAA.
This is a design choice, not an afterthought: investigation agents that run inside your own VPC mean logs, traces, and metrics never leave your network boundary, and every automated action still lands in an auditable timeline. If your team has told a security or compliance reviewer 'no, that data does not leave our environment' about anything else in your stack, it is worth asking the same question about whatever is investigating your incidents.
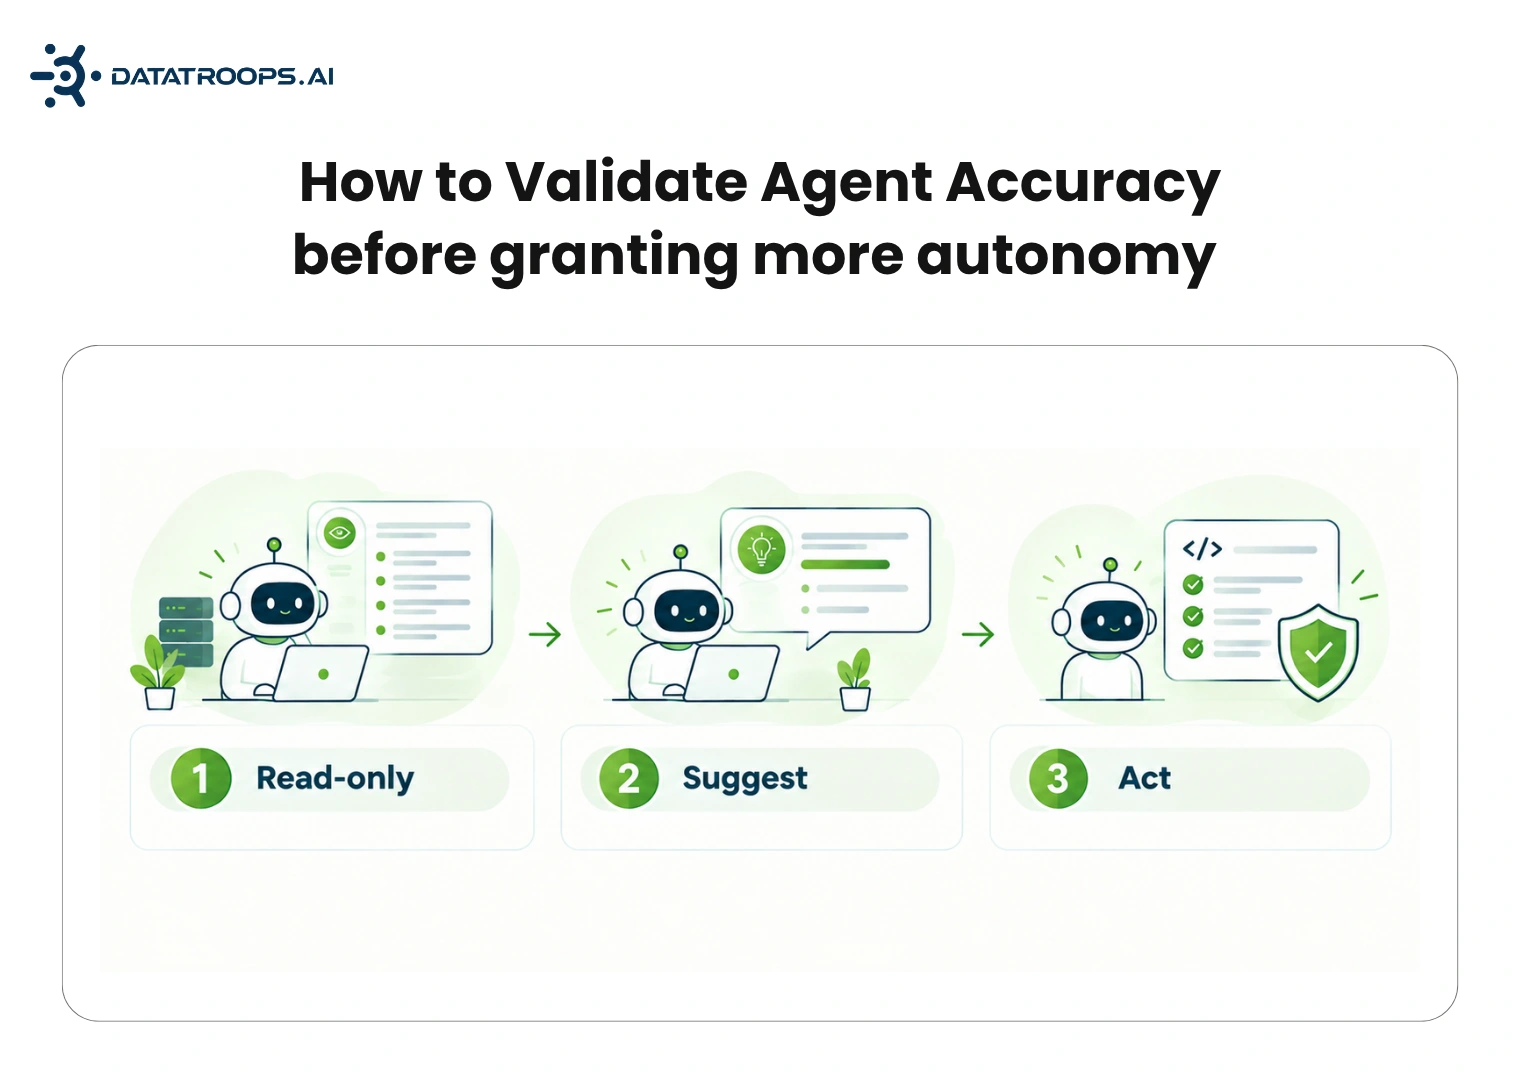
The single most common way automation programs lose trust is granting an agent permission to act before anyone has verified that it is usually right. The fix is a staged rollout with a measurable gate at each step:
Treat that agent-diagnosis-accuracy number as a hard gate, not a vibe. If it is not being tracked, there is no real basis for deciding the agent is ready for more autonomy, just an assumption that it probably is.
A consumer group starts falling behind on a high-throughput topic. Downstream, that shows up as delayed data 20 to 30 minutes later, by which point it looks like a completely unrelated freshness problem on a dashboard three teams away from the actual cause.
Before An engineer notices stale data, opens a ticket, and starts working backward: the dashboard, then the service that populates it, then the service before that. Forty-five minutes in, someone finally checks consumer lag on the relevant topic and finds the real cause: a downstream consumer that has been silently falling behind since a deploy two hours earlier.
After A stack-aware investigation agent watches consumer lag directly as a first-class signal, rather than inferring it from downstream symptoms. It flags the lagging consumer group within three minutes of it crossing a meaningful threshold, and correlates it against the deploy that coincided with the slowdown. An engineer reviews the finding, confirms it, and approves a restart of the lagging consumer. Total time to root cause: under three minutes, down from 45.
The difference is not that the second team is smarter. It is that the automation was watching the right signal in the first place.
Before investing further, it is worth answering honestly:
If more than one of those does not have a confident answer, that is not a failure. It is just where most teams actually are. It is also exactly the gap a structured review is meant to close.
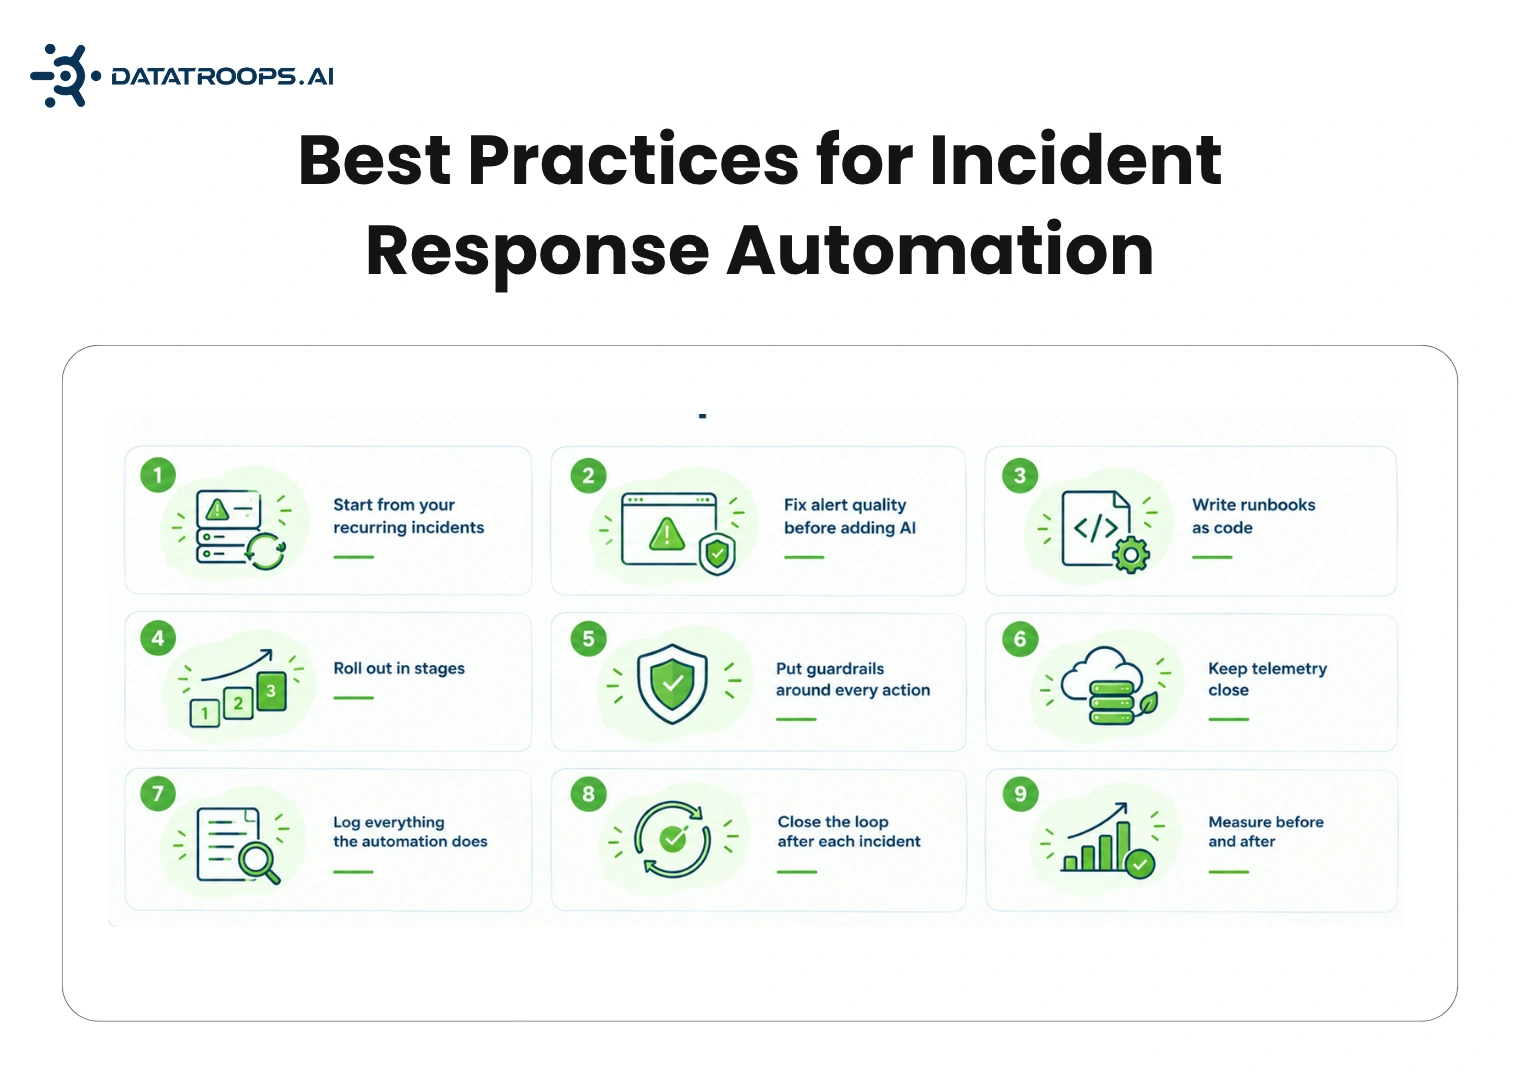
Incident response automation pays off fastest when it targets your own recurring incidents, starts read-only, and earns the right to act over time. The tools available in 2026 are genuinely mature. The harder, less glamorous part is the groundwork underneath them: clean alerts, runbooks as code, clear guardrails, and a real baseline to measure against.
That groundwork is exactly where generic tooling and generic advice run out, especially for JVM, Scala, Kafka, and data-pipeline stacks, where the failure modes that cost teams the most time are the ones generic agents are least equipped to recognize. That is the gap DataTroops is built to close: stack-aware automation, run inside your own infrastructure, backed by engineers who have debugged these exact systems before.
A good first step is our Production Health Assessment. We review your last 90 days of incidents and alerts and hand you a ranked list of your top 5 automatable incidents, in two weeks.Talk to us.
Get a ranked list of your top 5 automatable incidents from a review of your last 90 days of incidents and alerts, delivered in two weeks.
Key takeaways and architectural details Settled for engineers and team leads.
SOAR (Security Orchestration, Automation, and Response) is a category of incident response automation focused specifically on security incidents such as phishing, ransomware, and compromised credentials. Incident response automation more broadly also covers reliability and availability incidents, such as outages, latency spikes, and failed deployments, which is a different (though overlapping) toolset and workflow.
Yes, if they are given permission to act before their accuracy has been validated. This is exactly why the read-only, suggest, then act staged rollout matters. An agent that is wrong 20% of the time is a useful investigator and a dangerous actor.
No. SOAR platforms are purpose-built for security playbooks. For infrastructure reliability incidents, the more relevant category is incident management plus AIOps plus investigation agents, which is a different set of tools entirely.
It varies widely by path. A SaaS platform can be running within a week for a few hundred to a few thousand dollars a month, depending on scale. DIY costs engineering time rather than a subscription. Managed options are priced around the ongoing expertise and infrastructure involved rather than a flat license fee.
Whatever shows up most often in your last 90 days of incidents. Frequency, not severity, is the right first filter. A minor issue that recurs weekly costs more engineering time over a quarter than a severe issue that happens once.
Deploy autonomous agents inside your environment to investigate alerts, diagnose incidents, and generate verified fixes.