


Agentic AI & Production Automation Expert
Datadog and Dynatrace are two of the most widely adopted observability platforms, but they are built on different philosophies. Datadog is a modular, integration-rich platform that gives teams flexibility and fast time to value. Dynatrace is a more opinionated, automation-first platform that emphasizes automatic discovery, topology awareness, and deterministic root-cause analysis. Neither is universally better. The right choice depends on your architecture, team size, budget model, and how much customization versus automation you want. This guide compares both tools across architecture, AI capabilities, pricing, and operations, and offers a practical framework for choosing.
Datadog is a cloud-based observability and security platform delivered as software as a service. It started with infrastructure monitoring and expanded into a broad suite covering application performance monitoring, log management, real user monitoring, synthetic testing, network monitoring, security, and more.
Key characteristics include:
Datadog’s strength is breadth and flexibility. Its trade-off is that getting the most from it usually requires deliberate configuration, tagging discipline, and ongoing cost management.
Dynatrace is an observability platform built around automation and a unified data model. Its agent-based approach aims to discover hosts, services, processes, and dependencies automatically, then maintain a live map of how everything connects.
Key characteristics include:
Dynatrace’s strength is automation and depth of context. Its trade-off is that it is more opinionated, and some teams find the platform and licensing model take longer to learn.
| Dimension | Datadog | Dynatrace |
|---|---|---|
| Core philosophy | Modular, flexible, integration-rich | Automated, topology-driven, platform-centric |
| Instrumentation | Agent plus integrations and tracing libraries; more manual choices | Automatic discovery and instrumentation through OneAgent |
| Dependency mapping | Service maps built from traces and tags | Continuous, automatically maintained topology model |
| AI approach | Anomaly detection, correlation, and assistant features | Causal, topology-based root-cause analysis plus predictive and generative features |
| Customization | Very high; teams build their own dashboards and monitors | Strong, but more guided by the platform’s model |
| Learning curve | Quick to start; depth grows with usage | More to learn up front; less manual setup afterward |
| Pricing model | Per product, usually by host, volume, or usage unit | Platform subscription based on consumption across capabilities |
| Best fit | Engineering-led teams, cloud-native stacks, fast-moving organizations | Large or complex estates, enterprises seeking automation and governance |
| Main risk | Cost sprawl and configuration inconsistency | Platform complexity and commitment to a single ecosystem |
Treat this table as a starting point. Both vendors ship frequent updates, so confirm current capabilities against official documentation.
Both platforms cover the full observability stack, so the real differences lie in how each capability is delivered and how much configuration it needs.
| Capability | Datadog | Dynatrace |
|---|---|---|
| Infrastructure monitoring | Agent plus a very large integration catalog across clouds and services | OneAgent discovers hosts, processes, and containers automatically |
| APM and tracing | Tracing libraries correlated with logs and metrics | Automatic, code-level tracing with little manual setup |
| Log management | Flexible ingest, indexing, and retention tiers; cost follows volume | Logs held in a unified data lakehouse and queried with DQL |
| Real user monitoring | Separate RUM and session replay products | Real user monitoring built into the same platform |
| Synthetic monitoring | Browser and API tests, with private locations | Synthetic checks tied to the same topology and AI engine |
| Kubernetes and cloud-native | Strong container and orchestration views, highly customizable | Automatic discovery of workloads and their dependencies |
| Security | Cloud and application security products added by module | Runtime application security and vulnerability analytics |
| Dashboards and exploration | Highly customizable dashboards, notebooks, and monitors | Dashboards and notebooks driven by one query language |
| AI assistance | Anomaly detection, correlation, and a generative assistant | Causal, predictive, and generative AI working on topology |
| Deployment | SaaS-first | SaaS, with self-managed options for stricter environments |
| OpenTelemetry | Supported; check ingest paths per signal | Supported; check ingest paths per signal |
Capability names and bundling change often, so confirm specifics for each product with the vendor before committing.
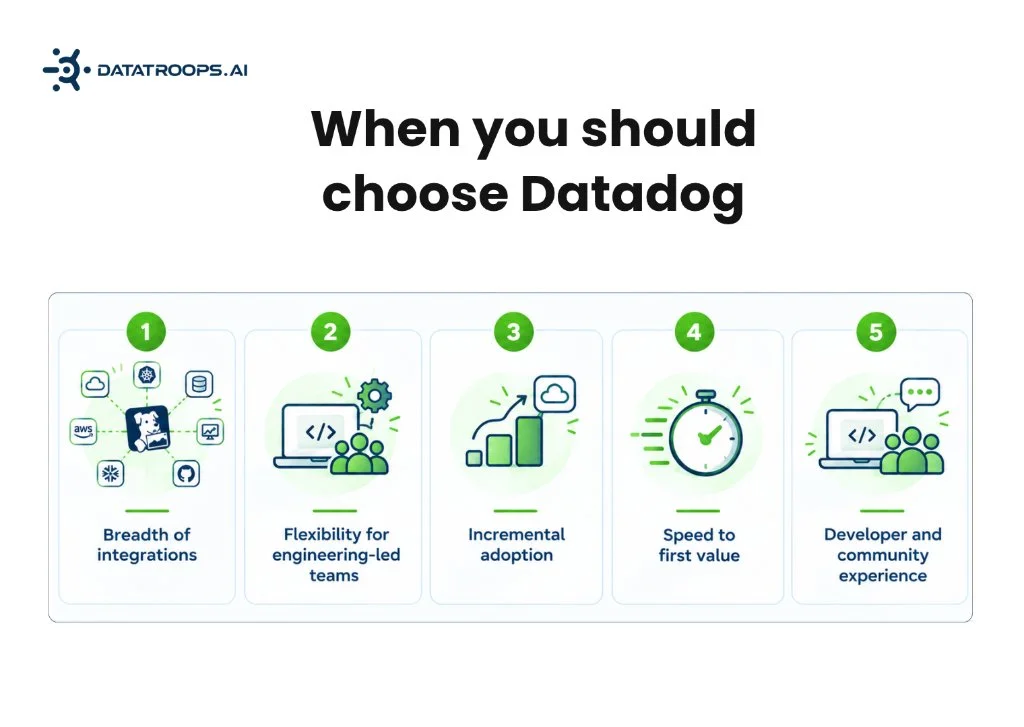
Datadog’s integration catalog is one of its biggest advantages. If your stack includes a mix of cloud services, SaaS tools, databases, and developer platforms, there is a good chance a maintained integration already exists. This shortens the path from “installed” to “useful.”
Teams that want control over dashboards, monitors, tags, and workflows tend to enjoy Datadog’s configurability. Platform and SRE teams can create shared standards while letting individual service teams tailor their own views.
Because products are modular, you can begin with infrastructure monitoring or logs and add APM, RUM, or security later. This lowers the barrier to entry and lets budgets grow in step with maturity.
Many teams can get dashboards and basic monitors running quickly, which is useful for startups, scale-ups, and organizations proving the value of observability before a larger rollout.
Strong documentation, a large user community, and a familiar interface make onboarding easier for application developers who are not full-time operations specialists.
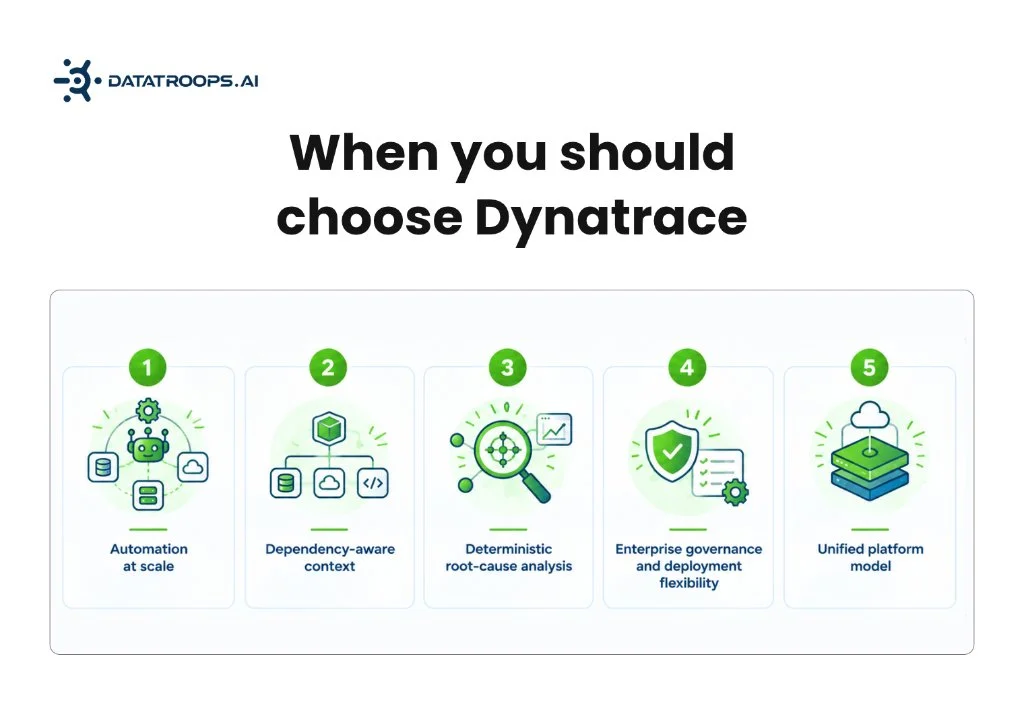
In large environments with thousands of hosts and constantly changing services, manual instrumentation and dashboard upkeep become costly. Dynatrace’s automatic discovery and continuously updated topology reduce that operational burden.
Because Dynatrace models how components relate to one another, an alert can arrive with context about affected services, upstream and downstream dependencies, and likely user impact. This helps responders understand blast radius quickly.
Dynatrace’s causal approach uses topology and event data to reason about cause and effect. In complex microservice environments, this can reduce the number of alerts responders must triage and make results easier to explain.
Organizations with strict data residency, compliance, or hybrid requirements often look closely at Dynatrace because of its enterprise-oriented deployment and governance options.
With a shared data platform and query language across telemetry types, Dynatrace can simplify analysis for teams that want a single, consistent way to explore observability and business data.
Both vendors market AI heavily, but they approach it differently.
Datadog applies machine learning to anomaly detection, forecasting, and correlation, and has added generative AI assistants that help users investigate issues, summarize findings, and navigate the platform. Its strength is flexibility: AI features layer on top of whichever products and data you have enabled.
Dynatrace emphasizes a combination of causal, predictive, and generative AI. Its root-cause analysis leans on the live dependency model, which can make explanations more traceable because they follow a known chain of relationships.
Regardless of vendor, apply the same discipline to any AI-generated insight:
AI shortens investigation time. It does not remove the need for sound engineering judgment, good instrumentation, or well-maintained runbooks.
Imagine checkout latency spikes shortly after a deployment. The table below sketches how a responder’s path typically differs. It is illustrative, since results depend heavily on how each tool is configured.
| Stage | Typical path in Datadog | Typical path in Dynatrace |
|---|---|---|
| Detect | A monitor or anomaly alert fires on latency or error rate | A problem is opened, grouping related anomalies into one event |
| Add context | Pivot from the alert to related traces, logs, and dashboards | Affected services, dependencies, and user impact appear on the problem |
| Find the cause | Compare deployments, traces, and tagged dimensions; the assistant can suggest leads | Causal analysis points to a probable root cause along the dependency path |
| Confirm | Responder validates in traces and logs using saved views and notebooks | Responder checks the evidence chain and the linked deployment event |
| Resolve and learn | Trigger a runbook or workflow; document findings in a notebook | Trigger an automation or workflow; review the problem timeline |
The contrast is one of style. Datadog gives responders flexible tools to explore. Dynatrace aims to arrive with an explanation already assembled. Either way, a human should verify the hypothesis before any state-changing action.
Cost is often the deciding factor, and it is also the hardest to compare directly because the two vendors package and meter their products differently.
The table below shows where each model tends to behave differently as you scale.
| Cost driver | Datadog | Dynatrace |
|---|---|---|
| Billing structure | Separate line items per product | Shared platform commitment drawn down by usage |
| Infrastructure | Typically per host or container | Based on monitored resources and consumption |
| Logs | Ingest and retention are priced separately; volume spikes raise cost | Consumption tied to ingested, retained, and queried data |
| Custom metrics | Can multiply quickly with high-cardinality tags | Metric ingest counts against the same platform consumption |
| Digital experience | RUM and synthetics priced as add-on products | Included in the same consumption model |
| Budget predictability | Easier to start small, harder to forecast at scale | Easier to forecast at scale, larger upfront commitment |
| Typical cost risk | Product sprawl across many teams | Overbuying capacity or underusing the commitment |
Datadog typically prices each product separately, often by host, ingested volume, or usage unit. This gives you control over what you pay for, but costs can rise quickly when log volumes grow, custom metrics multiply, or many products are enabled across many teams.
Dynatrace generally uses a platform subscription model where consumption across capabilities draws from a shared commitment. This can make budgeting simpler for large estates, though it requires understanding how different workloads consume capacity.
When modeling cost, include:
Because list prices and packaging change, request current quotes from both vendors and compare them against your real workload rather than a generic estimate.
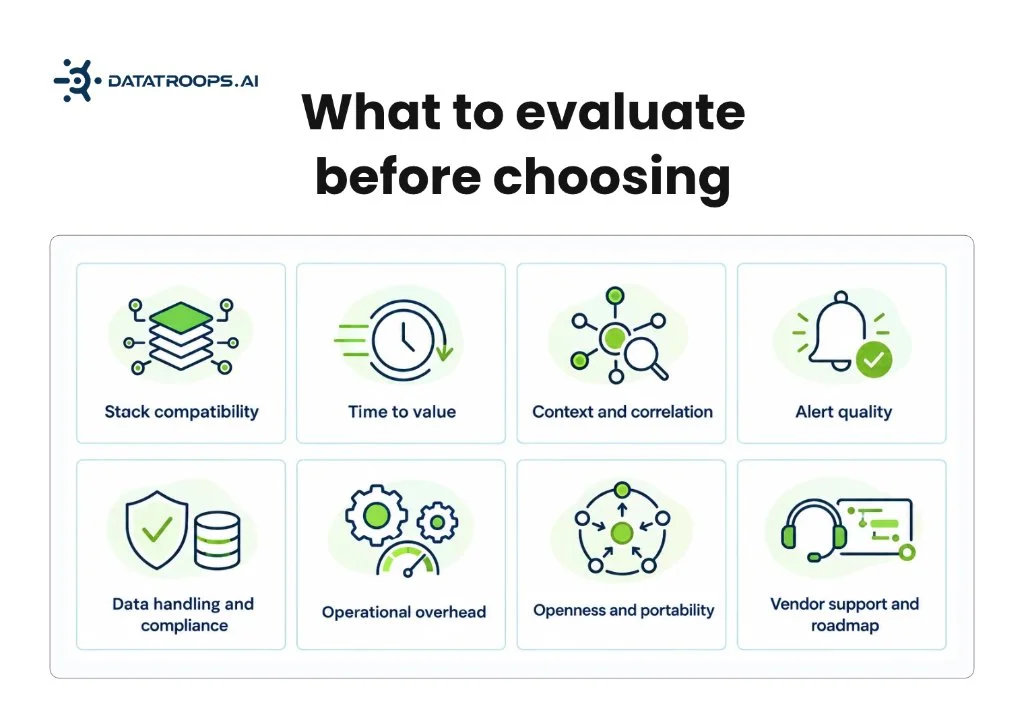
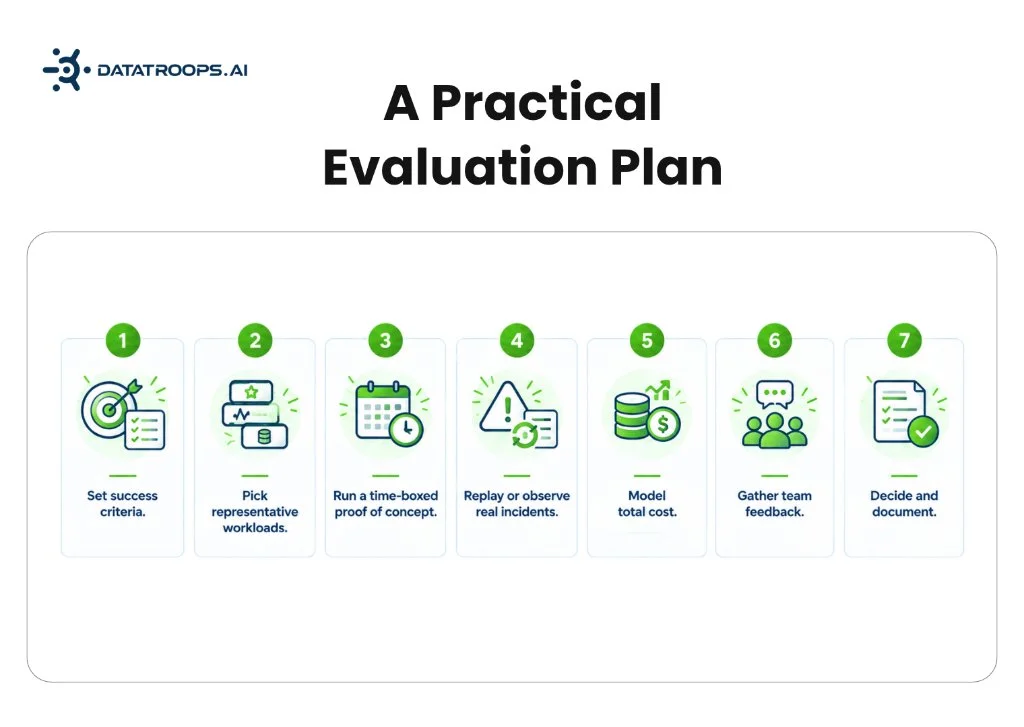
A useful evaluation goes beyond a product demo. Run both tools against a representative slice of your production or staging environment.
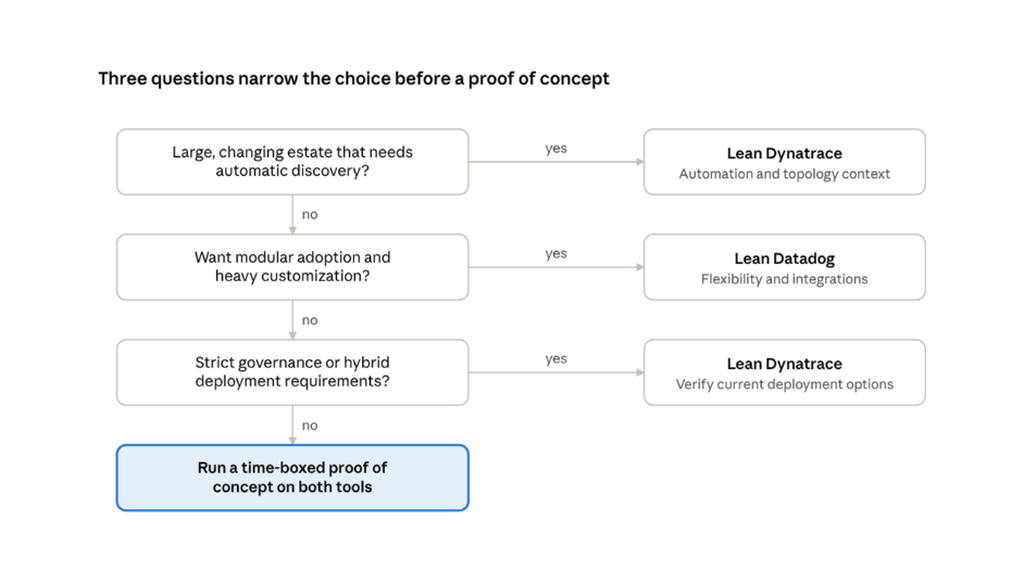
A yes to any question ends the path with a lean; three nos send you to a proof of concept on both tools.
| Your situation | Likely better fit |
|---|---|
| Small to mid-sized engineering team, cloud-native, wants quick setup | Datadog |
| Large enterprise with thousands of hosts and complex dependencies | Dynatrace |
| Want to adopt observability in stages and control spend per product | Datadog |
| Want automatic discovery and minimal manual instrumentation | Dynatrace |
| Heavy reliance on varied third-party integrations | Datadog |
| Need dependency-aware, explainable root-cause analysis | Dynatrace |
| Strict compliance, residency, or hybrid deployment needs | Dynatrace (verify current options) |
| Culture of customization and developer-owned monitoring | Datadog |
| Central platform team wanting standardization and governance | Dynatrace |
These are tendencies, not rules. A well-run Datadog deployment can outperform a poorly configured Dynatrace one, and the reverse is also true.
Datadog and Dynatrace are both mature, capable platforms, and the decision rarely comes down to a single feature. Datadog tends to reward teams that value flexibility, breadth, and incremental adoption. Dynatrace tends to reward organizations that value automation, topology-driven context, and consistency at scale. The most reliable way to choose is to test both against your real systems, measure the results against criteria that matter to your team, and keep human judgment and well-controlled automation at the center of your incident response.
Book a technical consultation with DataTroops engineers to review your telemetry architecture, reduce alert noise, and design reliable incident workflows.
Key takeaways and architectural details Settled for engineers and team leads.
Neither is better in every case. Dynatrace often suits large, complex environments that benefit from automation and dependency-aware analysis, while Datadog often suits teams that want flexibility, a broad integration catalog, and incremental adoption.
Datadog is commonly seen as quick to start, especially for cloud-native teams. Dynatrace aims to minimize manual instrumentation through automatic discovery, but its platform and licensing concepts may take longer to learn. Your own stack will determine the real experience.
It depends on your workload. Datadog’s per-product pricing can be economical for focused use but may grow with log and metric volume. Dynatrace’s platform subscription can simplify budgeting at scale. Request quotes based on your actual usage before comparing.
Both vendors support OpenTelemetry to varying degrees. Verify the specific signals, SDKs, and ingestion paths you plan to use, since support and maturity can differ by signal type.
Yes, some organizations run both, often during a migration or because different business units adopted different tools. This increases cost and complexity, so most teams aim to consolidate over time.
Migration usually involves re-instrumenting services, rebuilding dashboards and alerts, retraining teams, and running both tools in parallel for a period. Using OpenTelemetry and keeping monitoring definitions in code can make future migrations easier.
No. AI features can speed up triage, correlation, and summarization, but production systems still need engineers to validate findings, make high-risk decisions, and maintain the automation that executes fixes safely.
Choose representative services, define measurable success criteria, run both tools side by side for a few weeks, test them on real or replayed incidents, and compare results alongside projected total cost.
Deploy autonomous agents inside your environment to investigate alerts, diagnose incidents, and generate verified fixes.