


AI & Enterprise Technology Content Specialist
Alert fatigue causes missed incidents, slower response, and on-call burnout. This practical framework shows on-call teams how to audit noisy alerts, cut duplicates, set severity and ownership rules, and improve runbooks. Learn which metrics to track and how AI-assisted triage can help, so engineers respond to real problems instead of noise.
At 3 a.m., an on-call engineer receives an alert: CPU > 85% on worker-07. By the time the dashboard opens, CPU has returned to normal. The alert is acknowledged, but no action is taken.
When this happens repeatedly, engineers learn that most pages do not matter. That is alert fatigue, and it creates a dangerous outcome: real incidents receive the same attention as routine noise.
The solution is not simply fewer alerts. It is a better alerting system, one that pages only for urgent, actionable, user-impacting conditions and routes everything else to the right place.
Alert fatigue occurs when responders receive so many low-value, repetitive, or non-actionable notifications that they become slower to react to all alerts, including those that represent genuine incidents.
The consequences include:
Alert fatigue is different from general notification fatigue. Notification fatigue covers excessive messages across email, chat, and other channels. Alert fatigue specifically affects incident and monitoring signals that are supposed to drive a response.
The goal is not to eliminate every notification. The goal is to ensure that every page represents something worth interrupting an engineer to investigate.
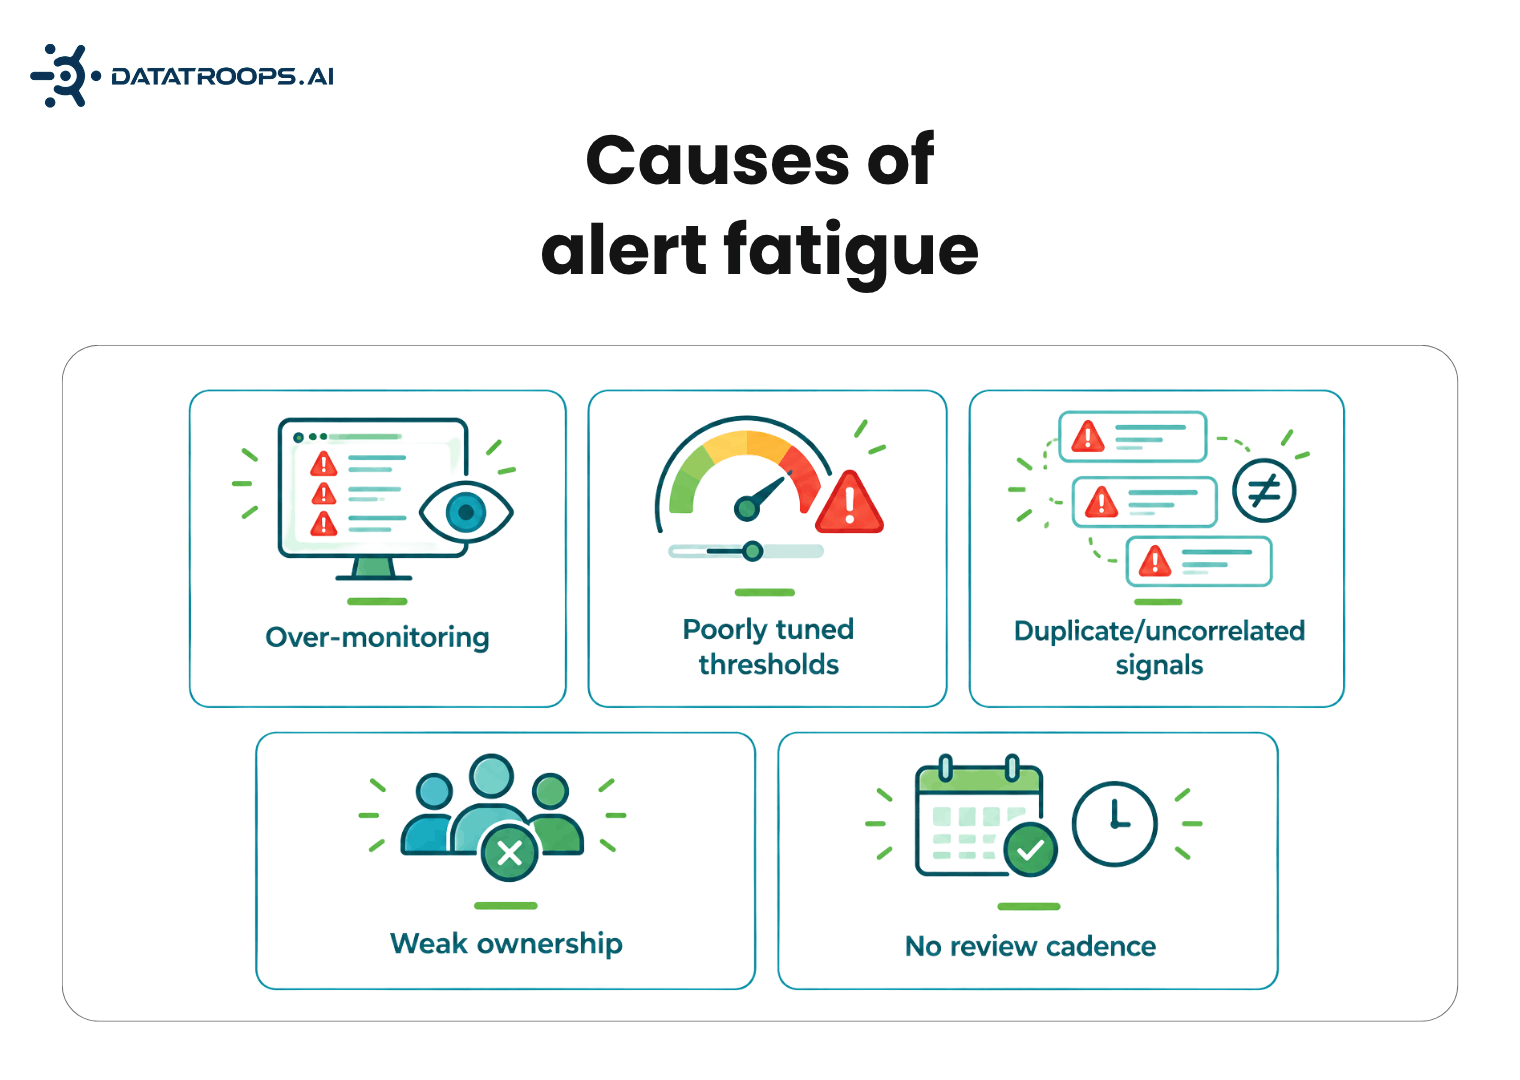
Alert fatigue rarely comes from one poorly designed alert. It usually develops as production systems grow without a consistent process for alert ownership, review, and maintenance.
Common causes include:
A high CPU reading, a pod restart, or a growing queue may be important diagnostic information. It does not automatically mean that an engineer should be woken up. A page should communicate that the situation requires timely human attention.
Alert fatigue creates several kinds of operational cost.
| Cost | What it looks like |
|---|---|
| Engineer time | Interruptions, context switching, and unnecessary investigation |
| On-call burden | More after-hours pages and disrupted sleep |
| Slower response | Real incidents receive the same attention as routine noise |
| Senior-engineer dependency | Experienced engineers repeatedly investigate the same patterns |
| Delivery impact | Roadmap work is interrupted by avoidable operational toil |
| Business risk | Delayed response may increase customer, revenue, security, or compliance impact |
Suppose a team receives 200 alerts per day and 90% are non-actionable. If each non-actionable alert causes only two minutes of interruption, the team loses approximately 30 engineer-hours per week across five working days.
That is an illustration, not a universal benchmark. The actual cost depends on alert volume, responder behavior, the time needed to understand each notification, and the complexity of the affected system.
To calculate your own baseline, track:
Before allowing an alert to page someone, evaluate it against five questions.
Is it urgent? Would waiting until the next business day materially worsen the situation?
Is it actionable? Can the responder take a meaningful next step, or is the alert only reporting an interesting condition?
Is it user-impacting? Does it affect customers, business operations, or a critical reliability objective?
Is it owned? Does a specific team know who should investigate and what escalation path to follow?
Is it unique? Is this the primary signal, or is it a duplicate or downstream symptom of another incident?
If an alert does not meet these criteria, it may still belong in a dashboard, ticket queue, daily report, or historical record. It may not belong on the paging channel.
A reliable alert-hygiene process follows six stages:
AUDIT → DEFINE → ROUTE → TUNE → AUTOMATE → REVIEW
Each stage produces a practical output that helps the next stage.
Before changing alert rules, understand where the noise is coming from.
Export 30 to 90 days of alert data from your paging, incident-management, and monitoring tools. Then review:
Classify each alert as:
Most teams discover that a small number of alert rules generate a disproportionate share of pages. That is useful because it means a focused review can produce significant improvement.
Output A ranked list of the noisiest alerts and a baseline alert-quality report.
The next step is to decide what deserves a page.
Create a written paging policy based on:
User-impacting symptoms are often better candidates for paging than isolated infrastructure metrics, while cause-level signals remain valuable for investigation.
| Cause-level signal | User-impacting symptom |
|---|---|
| CPU above 85% | Checkout error rate above 2% |
| Pod restarted | Customer requests are failing |
| Disk usage above 80% | Writes are being rejected |
| Database connections increased | Requests are timing out |
A CPU spike may be harmless in one service and dangerous in another. The important question is whether it indicates current or imminent impact.
A useful page should provide context such as:
Checkout service degraded. Error rate increased 4× over the last 10 minutes, affecting approximately 18% of requests. A recent deployment and elevated database connection wait time are possible contributing signals. Follow the linked runbook for initial investigation.
That is more useful than:
CPU > 85%
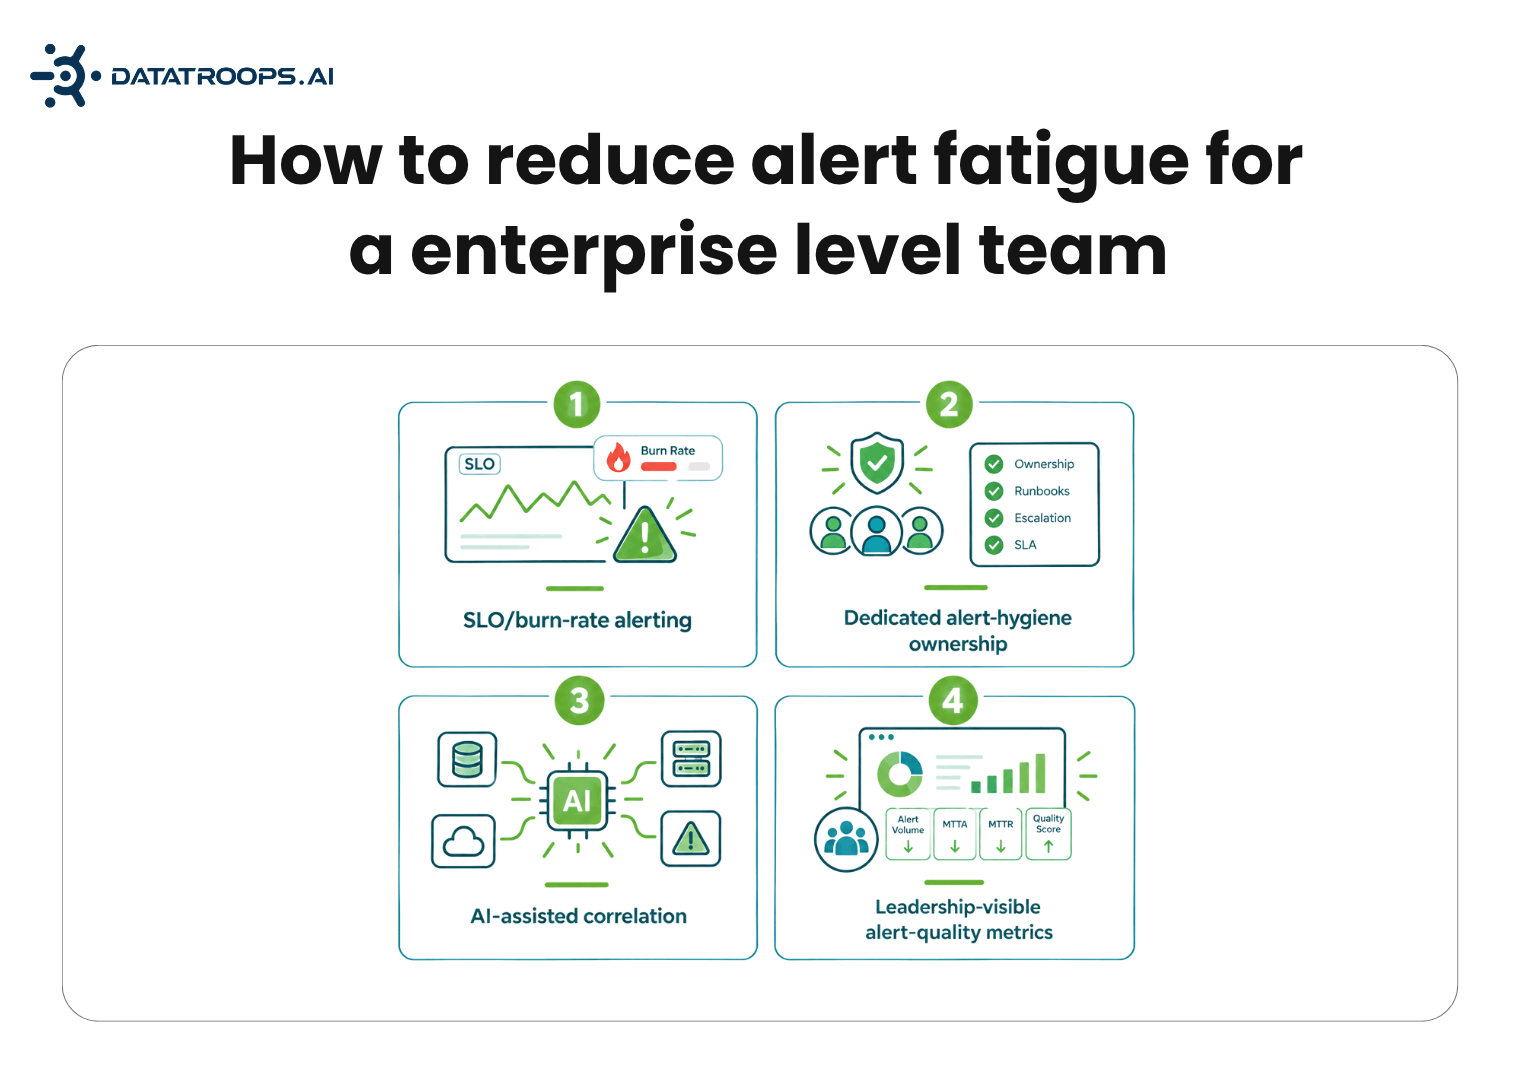
Teams with established service-level indicators and objectives can use error-budget burn-rate alerting to distinguish fast, severe degradation from slow-moving risk.
A fast burn rate can justify a page. A slower burn may create a ticket or business-hours investigation instead. Google's SRE guidance describes burn-rate alerting as a way to connect alerts to error-budget consumption rather than relying only on fixed thresholds.
Teams without reliable SLOs should first establish:
Output A documented paging policy that defines what pages, what creates a ticket, and what stays on a dashboard.
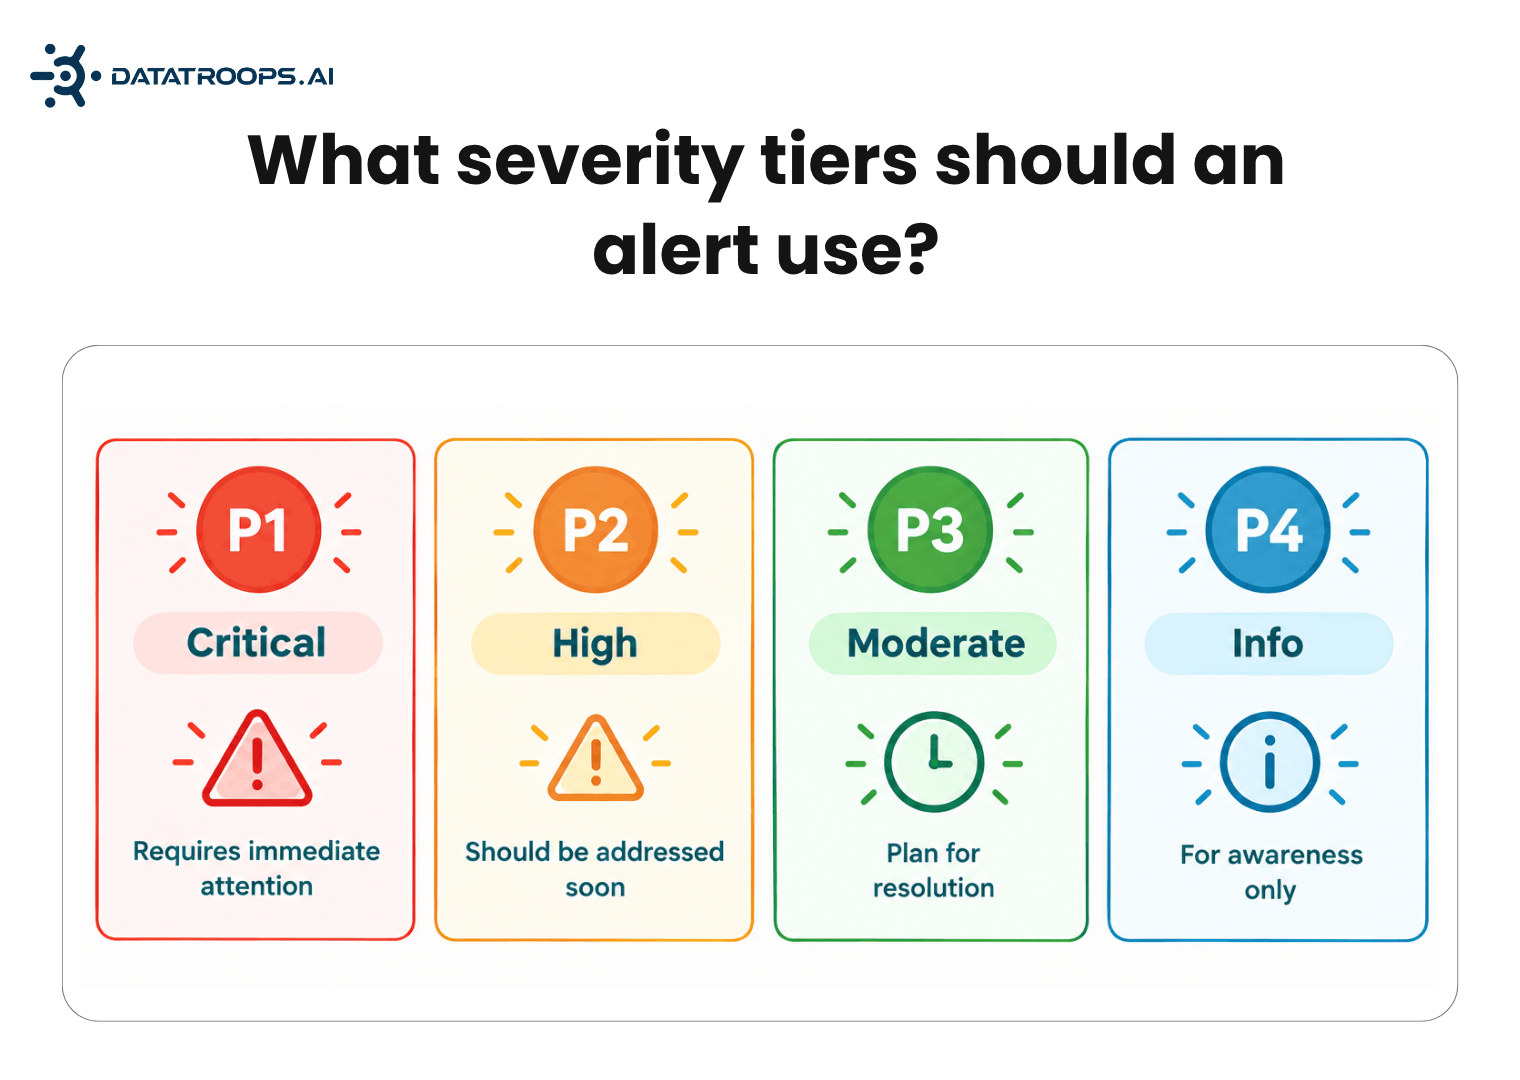
The right alert must reach the right team through the right channel.
A simple severity model can help:
| Severity | Meaning | Response | Channel |
|---|---|---|---|
| P1 | Active customer-impacting outage | Immediate response | Page or phone |
| P2 | Significant degradation or risk | Same day or within a defined window | Urgent channel or page |
| P3 | Non-critical issue | Business-hours investigation | Ticket |
| P4 | Informational signal | No immediate action | Dashboard or log |
Event-management systems commonly support deduplication, grouping, suppression, and severity-based routing. These controls are useful, but they still require good alert definitions and ownership.
Output Every alert has a severity, owner, channel, and expected response.
Now return to the highest-volume alerts identified during the audit.
For each alert, choose one of five actions:
Add evaluation windows Require a condition to persist for a defined period before it fires. This can reduce pages caused by short-lived spikes.
Add hysteresis Use different thresholds for firing and recovery so an alert does not repeatedly bounce between states.
Group related alerts One database outage should not generate a separate page for every dependent service. Group signals by service, cluster, region, or incident where appropriate.
Suppress downstream symptoms If the primary database is unavailable, downstream connection-pool and API-error alerts may be secondary symptoms. Suppress or link them to the primary incident rather than paging separately.
Respect maintenance windows Planned deployments, migrations, scaling events, and scheduled jobs should not create unexpected pages. Apply maintenance windows carefully so genuine unrelated incidents are not hidden.
Revisit thresholds using historical data Thresholds should reflect actual service behavior, traffic patterns, seasonality, and user impact. A threshold copied from another environment may be inappropriate for yours.
Do not delete every alert that auto-resolves without human action. Review it first. It may be better suited to a dashboard, ticket, lower-severity notification, or trend report.
Output A measurable reduction in noisy or duplicate pages without an increase in missed incidents.
Automation should begin only after alert quality has improved.
Start with enrichment Before automating remediation, make every important page more useful by attaching:
This reduces the time responders spend gathering context manually.
Automate only bounded actions A production action is a candidate for automation when it is:
Depending on the environment, examples may include:
Do not automate an action merely because it has happened repeatedly. Repetition does not prove that the action is safe in every context.
AI-assisted investigation AI can help:
AI can also be wrong. It may misattribute a root cause, overstate confidence, or suppress an unrelated signal. The safer operating model is to let AI investigate while deterministic policies control production actions.
A practical flow looks like this:
Telemetry → Signal correlation → Deduplication and grouping → Impact analysis → Evidence-backed hypothesis → Human review or policy check → Approved action → Verification and rollback
Output Faster investigation and fewer repetitive pages, with automated actions logged and reviewable.
Alert quality degrades as systems, traffic, dependencies, and ownership change. Alert hygiene must therefore be continuous.
Recommended practices include:
Ask these questions after an incident:
Output A repeatable alert-hygiene process instead of a one-time cleanup.
Alerting recommendations should reflect operational maturity, not just employee count.
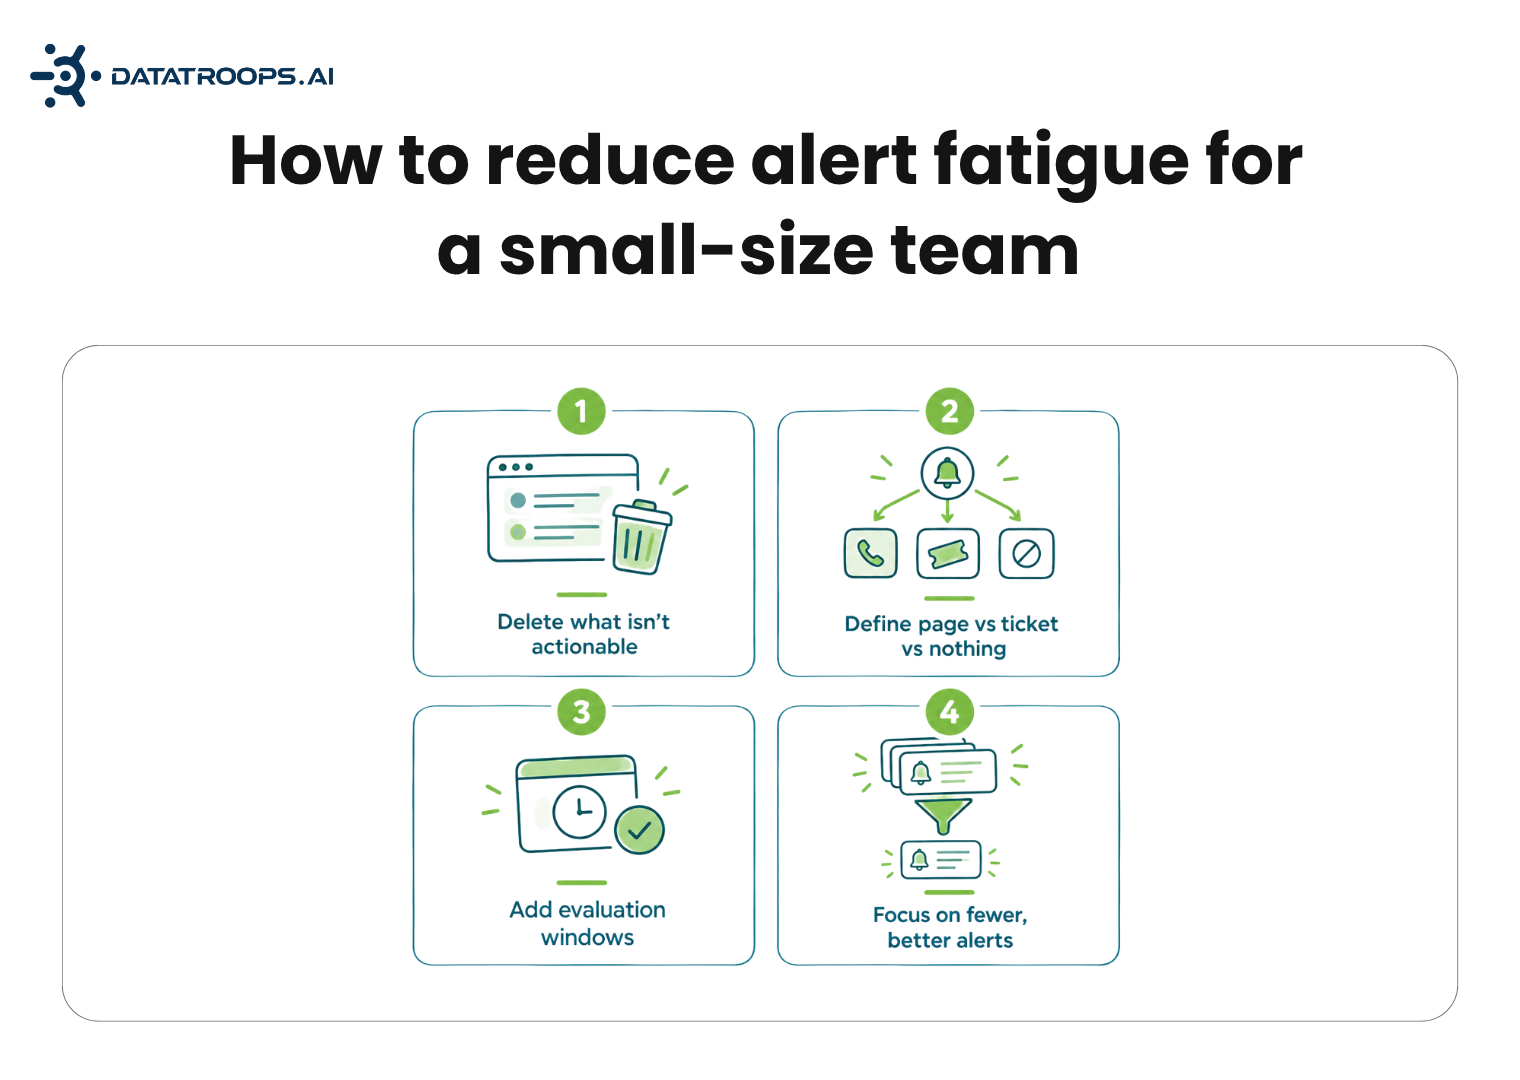
Typical characteristics:
Start with:
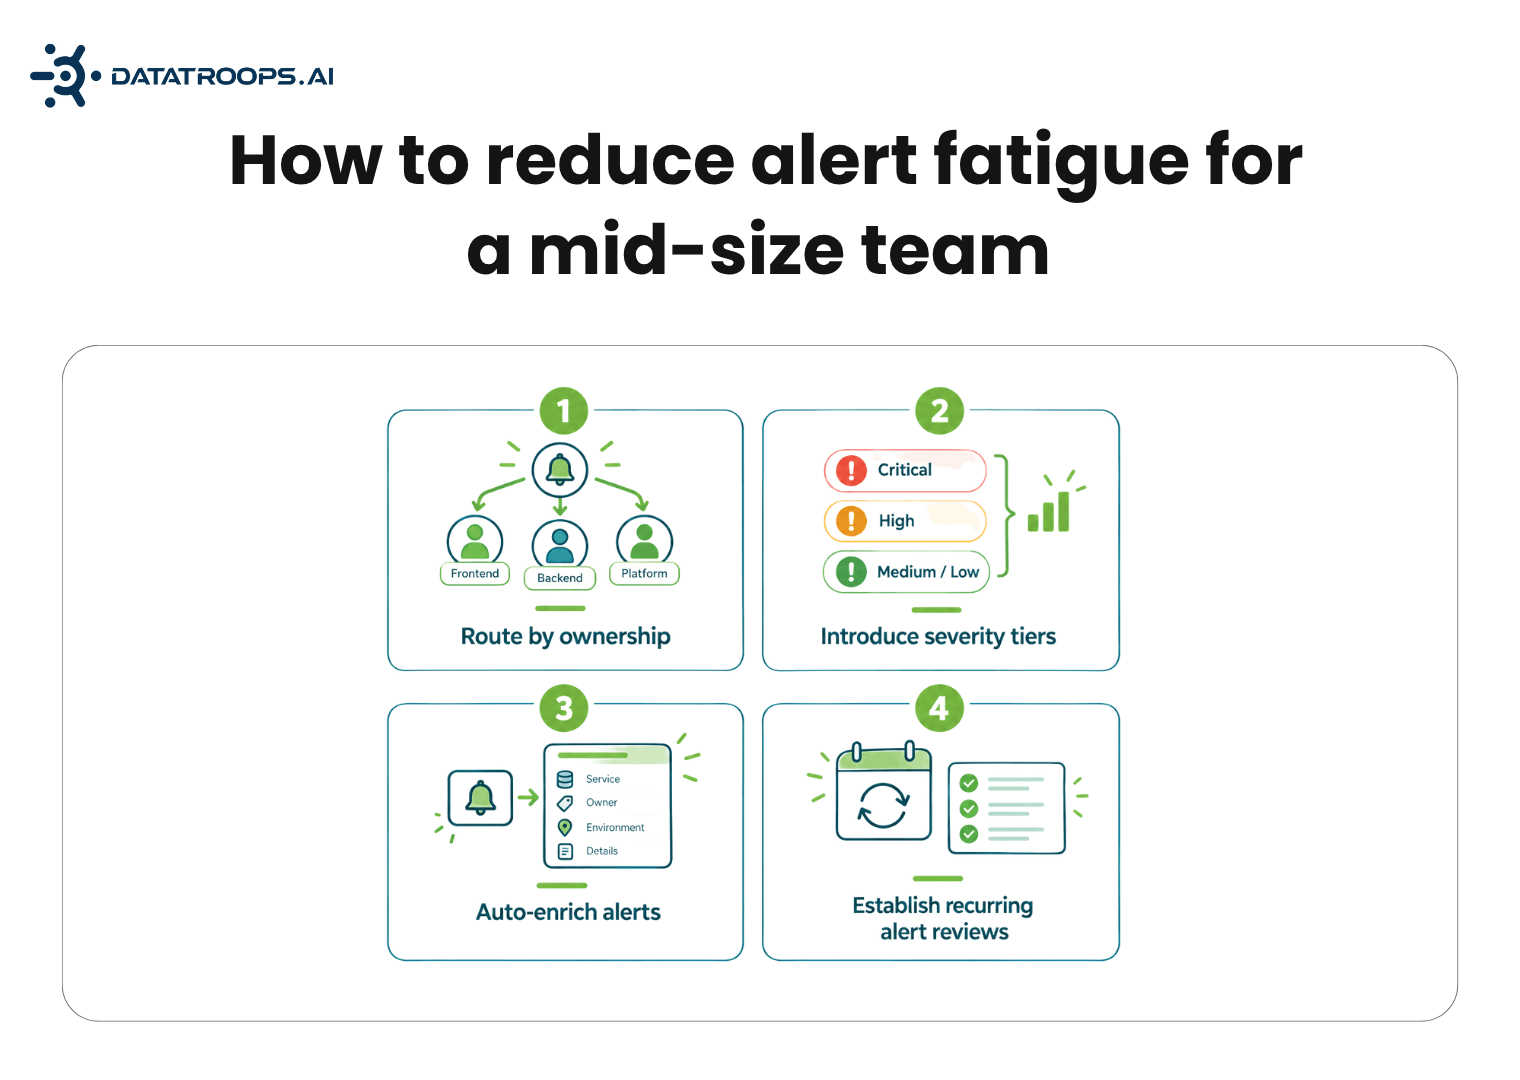
Typical characteristics:
Focus on:
Typical characteristics:
Add:
Use this template for every important paging alert:
| Question | Decision |
|---|---|
| What user or business impact does this alert represent? | |
| Is immediate action required? | |
| Who owns the affected service? | |
| What should the responder do first? | |
| Is this a unique signal or a duplicate? | |
| Should it page, create a ticket, or remain on a dashboard? | |
| What runbook and dashboard should be linked? | |
| What recent changes might be relevant? | |
| When was this alert last reviewed? | |
| What evidence supports the current threshold? |
Track trends rather than relying on one universal target.
| Metric | What it tells you |
|---|---|
| Pages per shift | Responder load |
| Actionable-page rate | Quality of pages |
| Duplicate-alert rate | Correlation quality |
| False-positive rate | Unnecessary notifications |
| Missed-incident rate | Whether suppression is too aggressive |
| After-hours pages | On-call burden |
| MTTA | Response speed and alert trust |
| MTTR | Resolution speed |
| Auto-resolved alert rate | Candidates for demotion or automation |
| Investigation time | Production-support burden |
A lower alert count is not automatically an improvement. Volume may fall because teams silenced notifications or stopped responding. Measure alert reduction alongside actionable rate, missed incidents, response time, and user impact.
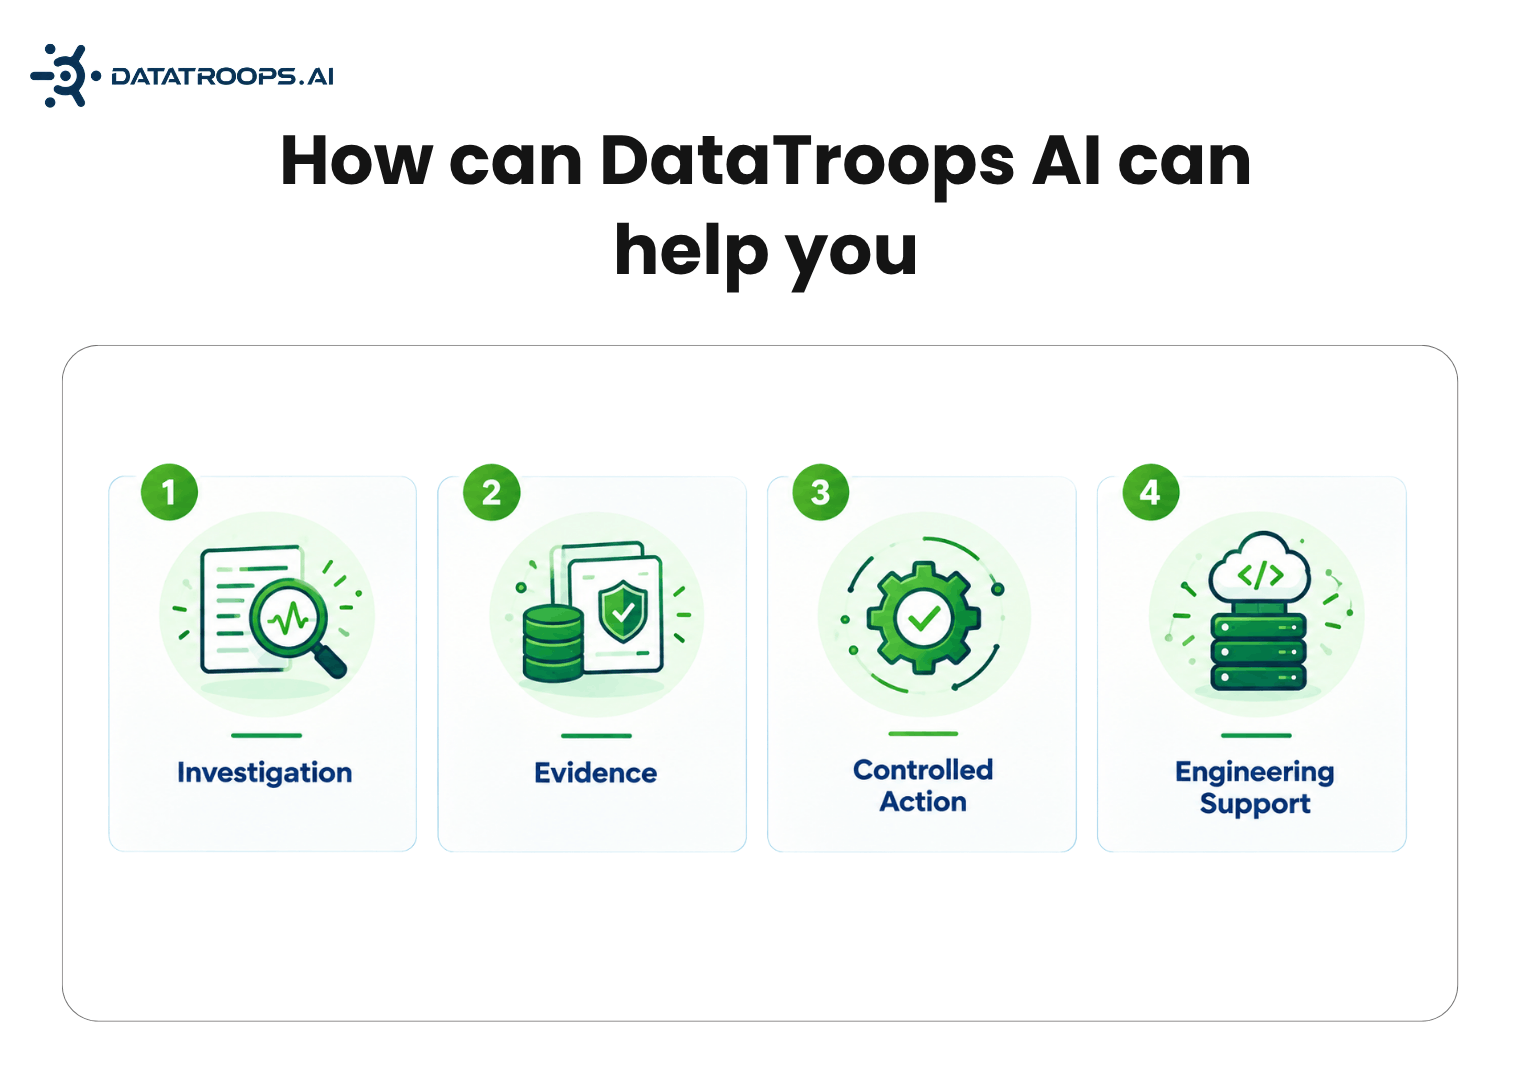
Alert hygiene reduces unnecessary pages. DataTroops addresses the next problem: what happens after the page arrives.
DataTroops combines AI-assisted production investigation with experienced engineering support. Agents can correlate logs, metrics, traces, deployments, dependencies, runbooks, and incident history to produce an evidence-backed investigation.
Production actions remain governed by access controls, approval policies, allowlisted workflows, verification, and rollback procedures. The AI should not become an unrestricted production operator.
Teams can begin with a Production Health Assessment using read-only access to understand:
If the assessment identifies suitable patterns, the next step can be a scoped Incident Automation Pilot.
Alert fatigue is not fixed by adding another dashboard. It is fixed by treating alerting as an operational system that needs clear standards, ownership, measurement, and regular maintenance.
Start by auditing your alerts, defining what deserves a page, routing by severity and ownership, tuning noisy rules, automating only safe repetitive work, and reviewing alert quality after every incident.
Alert hygiene reduces unnecessary pages. AI-assisted production investigation helps explain the pages that remain.
If your team knows alert volume is a problem but cannot quantify where investigation time goes, start with a Production Health Assessment. DataTroops uses read-only access to help identify recurring incident patterns, diagnosis effort, and workflows that may be safe to automate.
Start with a Production Health Assessment. DataTroops uses read-only access to help identify recurring incident patterns, diagnosis effort, and workflows that may be safe to automate.
Key takeaways and architectural details Settled for engineers and team leads.
There is no universal number. A better measure is whether pages are urgent, actionable, user-impacting, and routed to the correct owner. Track pages per shift alongside actionable-page rate, duplicate rate, MTTA, and missed incidents.
Alert fatigue is the desensitization that occurs when responders receive so many low-value or repetitive alerts that they become slower to react to genuine incidents.
User-impacting symptoms are often better candidates for paging, while cause-level signals are useful for diagnosis. The right design depends on the service, available SLOs, and operational context.
Review pages weekly or after meaningful incidents. Run a deeper audit monthly or quarterly, depending on how quickly services, traffic, and dependencies change.
AI can help group alerts, enrich incidents, correlate changes, summarize context, and suggest hypotheses. It should not be trusted with unrestricted production actions. Use policy controls, verification, rollback, and human approval for meaningful risk.
Not necessarily. Small teams can often improve alert quality through ownership, thresholds, routing, grouping, and runbooks before buying another platform. A paid platform or managed service becomes more relevant as alert volume, service count, escalation complexity, or diagnostic workload grows.
Deploy autonomous agents inside your environment to investigate alerts, diagnose incidents, and generate verified fixes.